Categories
Death + Crime Death + the Law

Dying by the Numbers in Europe

Who Dies of What in Europe Before the Age of 65
Elodie Cayotte and Hartmut Buchow, Eurostat (2009)

On the heels of last week’s post about mortality rates in New York City, comes this hot hot hot report on how Europeans are dying. Special thanks to my good friend Gauti for sending it along.

The usual postmortem causing suspects are covered: heart disease, lung cancer, alcohol related deaths, suicide, transport accidents, cervical cancer, and AIDS. I read this report, in a bar, while drinking a pint of beer (I live in England…) which seems fitting given the high number of alcohol related deaths in the UK. Indeed, the report sums up overall EU mortality rates this way:

The countries with very low mortality below age 65 are Italy, Switzerland, Malta, Norway, Sweden, Iceland, the Netherlands and to a lesser extent Spain. Within the United Kingdom, there is a strikingly large north-south division that encompasses the whole range of EU mortality. A number of former industrial areas with high mortality are found in Northern England and the north- east of France.

And let me tell you, the North-South divide in England is intense. A person might as well just give up the ghost if he or she lives north of the Midlands. The difference in life expectancy between Southern England (where I live in lovely Bath) and the North is almost seven years. Across the board, in every category, death seems to lurk at every turn in Northern UK regions. It seems that television ads have become extremely important in this public health dilemma and I found the following binge drinking gems, per usual, on YouTube.

Categories
Death + Crime Death + the Law

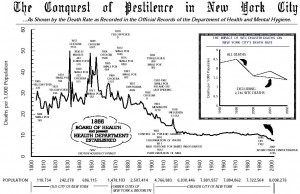
Dying by the Numbers in New York City

In the City’s Vital Statistics, so Many Ways to Die by Accident
Al Baker, New York Times (February 15, 2010)

Summary of Vital Statistics 2008
Bureau of Vital Statistics, New York City Department of Health and Mental Hygiene (January 2010)

‘Tis the Season for Annual Reports on Mortality Statistics. The City of New York has now released its 2008 numbers for all forms of human death. Good news for Gotham: homicides are down and so are accidental deaths. That said, at least one person is killed a week while walking. Make sure and wait for the crosswalk sign.

Here is an interesting section from the New York Times article at the top on the overall mortality rate changes.

In 2008, of the 54,193 people who died in the city, 1,044 deaths (excluding drug overdoses) were classified by the city’s Department of Health and Mental Hygiene as accidental — an 8.8 percent decline from 1998, when there were 1,145 accidental deaths. In contrast, the number of homicides fell 17.5 percent in that same period. The contrast is more stark going back to 1993: accidental deaths have fallen by 30.1 percent, while homicides have dropped by 73.2 percent…

…There are roughly 6,000 codes used to define deaths by accident, reflecting all types of violence and disorder. People are run over by cars, buses or taxis. There are dozens of codes to define deaths from drug consumption. Some die from the smoke and flames of fires, or they fall at construction sites or in their own backyards. Others are hit by trains, drown at beaches or crash their bicycles.

I understand why Departments of Health compile these statistics because it is useful to know how people are dying in a local area. Lawyers generally like to know these numbers too and a good funeral director can just tell you how people are dying without even looking at the vital statistics. Death by the numbers, as I like to call it, also reminds me of Meg’s recent post on Life Insurance Policies. Mix in bizarre, insane, unbelievable accidents and you basically have the annual Darwin Awards.

But I digress…

If you are a true student of Mortality statistics (and I have some friends who are) then please download the official 2008 report by the New York City Department of Health and Mental Hygiene, Bureau of Vital Statistics.

And if your attention span can’t handle charts, graphs, and brief descriptions of tragedy then please, oh-please, watch these short Public Service Announcements about preventing accidental deaths in the workplace. I am always amazed at what YouTube offers when you really need a solid bit of video:

Categories
Death + Biology

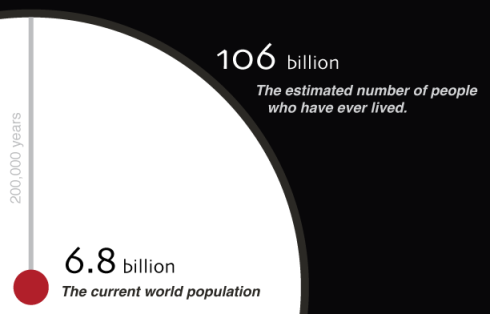
The Population of the Dead

Despite the numbers of the dead being admittedly “highly speculative” in this visualization of the world’s population of the dead, I’m always a sucker for infographics. Click the image excerpt below to see the whole thing, or check out the blog post about it from the creator, Jonathan Gosier at Appfrica.